Cart is empty


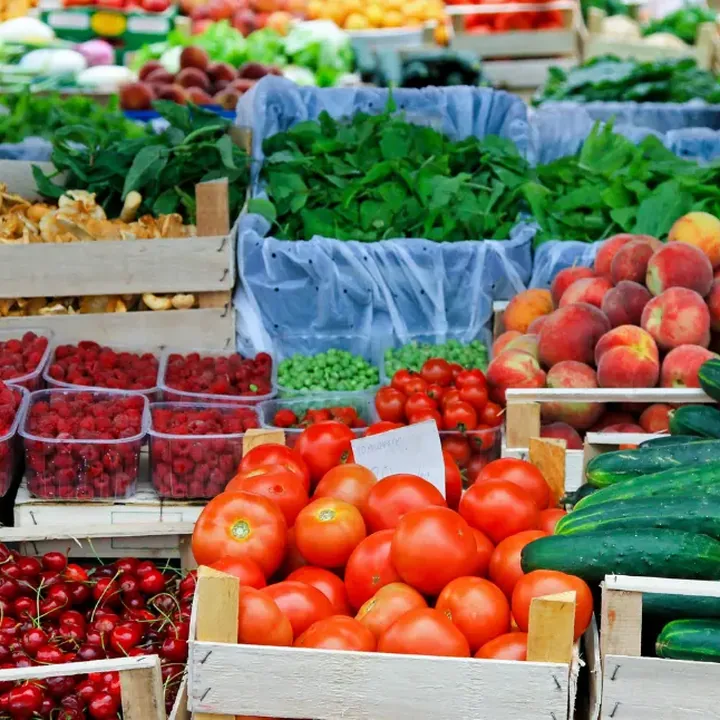
The short answer: in the US, food travels about 1,640 kilometers (roughly 1,020 miles) on its final trip from producer to store, and about 6,760 kilometers (roughly 4,200 miles) across its whole supply chain. Those averages come from a 2008 study by Christopher Weber and H. Scott Matthews in Environmental Science & Technology.
The same study found that transport made up 11 percent of the life-cycle greenhouse gas emissions of the average US household's food, and the final delivery leg just 4 percent. Producing the food made up 83 percent.
A larger 2022 study in Nature Food estimated a much bigger transport share worldwide, about 19 percent, and drew pushback on its assumptions. Below, each figure carries its year, place and scope.
How far does food travel
Two numbers, both older than they look
Most food miles statistics you will see trace back to two sources: a 2001 Iowa report about produce trucked into Chicago and the 2008 national estimate above. Our earlier post on local artisans and farmers covers food miles as an idea. Here is where the numbers come from.
1
Produce in 1998
1,518 miles, average truck trip to the Chicago terminal market
2
Final delivery
1,640 km (about 1,020 miles), producer to store, US average, 2008 study
3
Whole chain
6,760 km (about 4,200 miles), the full US food supply chain, same study
4
Imported produce
59% of fresh fruit and 35% of fresh vegetables in the US supply were imported in 2023
The "1,500 miles" line comes from Food, Fuel, and Freeways, a June 2001 report by Rich Pirog and colleagues at Iowa State University's Leopold Center for Sustainable Agriculture. Using USDA arrival data, they found that fresh produce arriving by truck at the Chicago terminal market in 1998 had traveled an average of 1,518 miles, 22 percent more than the 1,245 miles recorded in 1981.
1,518 mi
average distance fresh produce traveled by truck to the Chicago terminal market in 1998
44.6 mi
average distance food traveled in Iowa local food projects, vs an estimated 1,546 miles through conventional sources
6,760 km
average life-cycle supply chain distance for US food, about 4,200 miles
An old, narrow numberThe 1,518 miles describes produce only, trucks only and one city's wholesale market, using 1998 data. The report notes that USDA stopped collecting those arrival figures in 1998 and that terminal markets handled only about 30 percent of produce volume. It is a real finding, and it is not a measure of a typical grocery basket today.
The 2008 study took a wider view. Its 1,640 km covers the delivery of finished food from producer to retail across the US diet. The 6,760 km adds the miles traveled upstream through the rest of the supply chain. Both are modeled averages published in 2008, so no single item on your table will match them.
Imports have grown since then. In a January 2025 Chart of Note, USDA's Economic Research Service reported that imports supplied 59 percent of the fresh fruit available to US consumers in 2023, up from 50 percent in 2007. For fresh vegetables (not counting potatoes, sweet potatoes and mushrooms), the import share rose from 20 to 35 percent. Mexico supplied 51 percent of fresh fruit import value and 69 percent of fresh vegetable import value in 2023, Canada 2 and 20 percent.
Fresh fruit, 200750%
Fresh fruit, 202359%
Fresh vegetables, 200720%
Fresh vegetables, 202335%
Source: USDA Economic Research Service, Chart of Note, January 16, 2025. Vegetables exclude potatoes, sweet potatoes and mushrooms.
Food transport emissions vs the whole carbon footprint of food
Transport is a small slice for most foods
How far does food travel? The section above answers that in miles. For the climate, the better question is what share of the carbon footprint of food comes from moving it, one link in a long food supply chain. Three widely cited studies give three different answers, and the reasons they differ are useful.
Global food miles, Li et al. 2022about 19%
US household food, all transport, Weber and Matthews 200811%
Global food system, transport, Poore and Nemecek data via OWID6%
US household food, final delivery only, Weber and Matthews 20084%
Sources: Li et al., Nature Food (2022), Weber and Matthews, Environmental Science & Technology (2008), Our World in Data (2019) using Poore and Nemecek, Science (2018). Each study uses a different scope and method.
The 2022 global estimate
Bigger numbers, contested assumptions
Li and colleagues modeled food trade across 74 world regions and 37 economic sectors and estimated food-miles emissions at about 3.0 billion tonnes of CO2 equivalent a year, 3.5 to 7.5 times higher than earlier estimates. That came to about 19 percent of total food system emissions in their accounting of transport, production and land-use change. Moving fruit and vegetables made up 36 percent of food-miles emissions, almost twice what growing them released.
Carbon Brief's coverage adds detail. High-income countries, with about 12.5 percent of the world's population, accounted for 52 percent of international food miles and 46 percent of the emissions tied to them. International trips made up 71 percent of food miles, yet domestic transport produced 1.3 times more emissions. Some 94 percent of domestic food transport goes by road, while 93 percent of international food freight goes by ship. Ending all international food transport would cut food-miles emissions by only 9 percent. Ulrich Kreidenweis, a researcher quoted in that piece, said he would interpret the results with caution, since some of the authors' choices, such as the mass of food transported and the emissions from some transport modes, may lead to a strong overestimation.
The farm-level evidence
What the food is matters far more
A widely used farm-level dataset comes from Joseph Poore and Thomas Nemecek, published in Science in 2018 and covering more than 38,000 farms in 119 countries. Our World in Data's summary of that work puts food at about 26 percent of global greenhouse gas emissions. Transport accounts for 6 percent of food system emissions, and food that is lost or wasted for about a quarter.
26%
of global greenhouse gas emissions come from food production and supply chains
60 kg
of CO2 equivalent per kilogram of beef from beef herds, vs about 1 kg for peas
0.16%
of food miles go by air, yet air freight emits about 50 times more than shipping per tonne-kilometer
A 2020 Our World in Data analysis by Hannah Ritchie uses the same dataset food by food. Land use and farm-stage emissions make up more than 80 percent of the footprint for most foods. Transport is under 10 percent for most foods, and about 0.5 percent for beef from beef herds. The same analysis notes that lettuce imported from Spain to the UK in winter can carry 3 to 8 times lower emissions than lettuce grown in the UK at that time of year.
Weber and Matthews reached the same conclusion for US diets. Red meat was about 150 percent more greenhouse gas intensive than chicken or fish, and they calculated that shifting less than one day a week of calories from red meat and dairy to chicken, fish, eggs or a vegetable-based diet would cut more emissions than buying all food from local providers.
Where distance does matter
Air freight & inefficient loads
A 2010 USDA Economic Research Service report on local food systems reviewed the transportation emissions research and found that studies disagree on whether local food uses less energy. Large loads in the mainstream system can offset the shorter distance of small local deliveries, and the studies it reviewed found few significant differences other than for air-freighted products. It also notes that production, processing and household storage and preparation each take a larger share of US food system energy than transport.
Wikipedia's summary of transport distance research traces the term food miles to the UK in the early 1990s, and the measure has been argued over ever since. Food transport emissions are real and worth trimming. They sit inside much larger food system emissions from land use, farming and waste.
| Study | Year, scope | Transport share | What to keep in mind |
|---|---|---|---|
| Food, Fuel, and Freeways | 1998 data, Chicago produce | Distance only, no emissions share | One market, trucks only |
| Weber and Matthews | 2008, US household diet | 11% all transport, 4% final delivery | Older data, US only |
| Poore and Nemecek via OWID | 2018 data, global | 6% of food emissions | Farm-level data, 119 countries |
| Li et al. | 2022, global | About 19% of food emissions | Larger scope, contested assumptions |
What a local grocery market changes
What you buy outweighs how far it rode
A local grocery market can shorten the last leg of the trip and make it easier to ask where food came from. The research suggests that the local food environmental impact depends more on what is on the shelf and how it was grown than on the miles alone.
A food miles checklist that matches the research0 of 5 done
That last point comes from the same ERS report: there is no generally accepted definition of local food. The 2008 Farm Act counted a product as locally or regionally produced if it traveled less than 400 miles or stayed within its state, and stores and programs often set their own lines.
Ordering pantry goods by parcel from a maker several states away is not a low food-miles choice in itself, and it would be wrong to sell it as one. What it does give you is a name and a place. On LocalCart, each maker ships its own products, so items from two makers arrive as two shipments with two shipping charges at checkout. Grouping a few items from one maker keeps it to a single box.
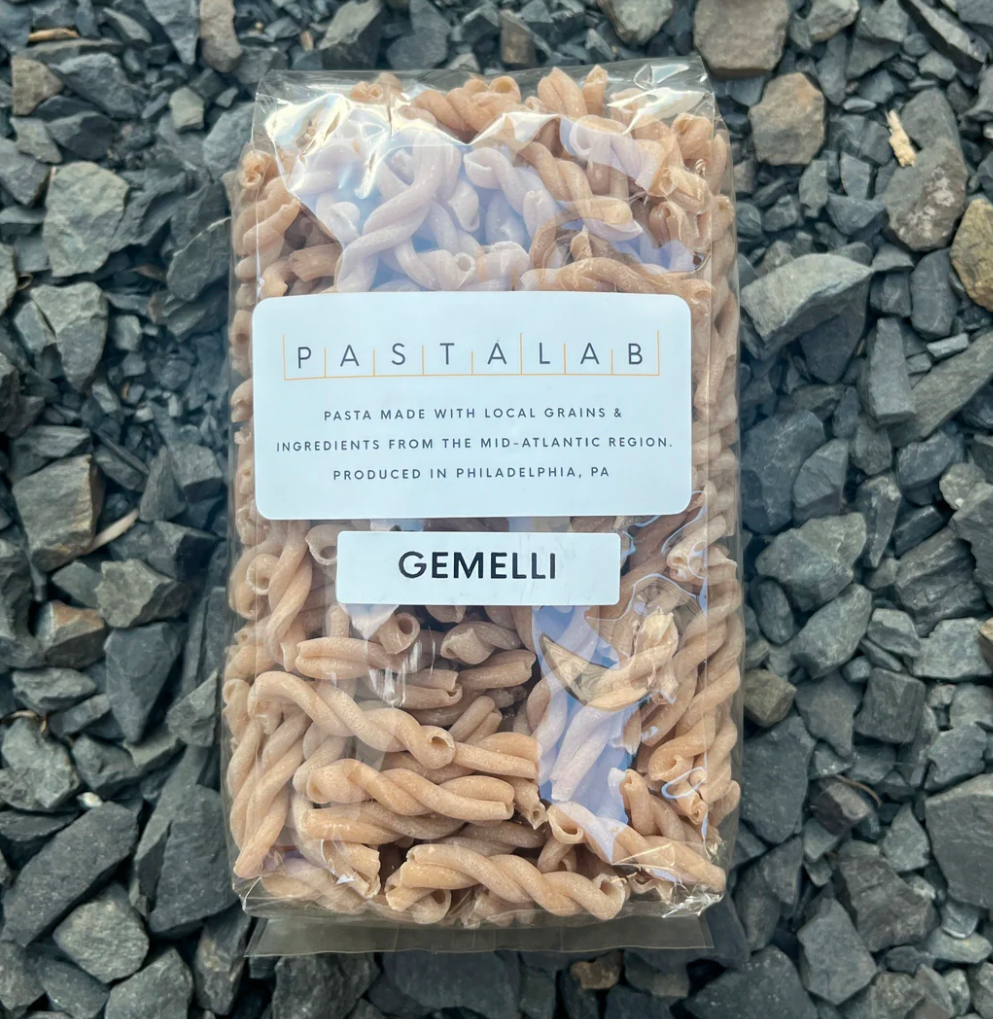
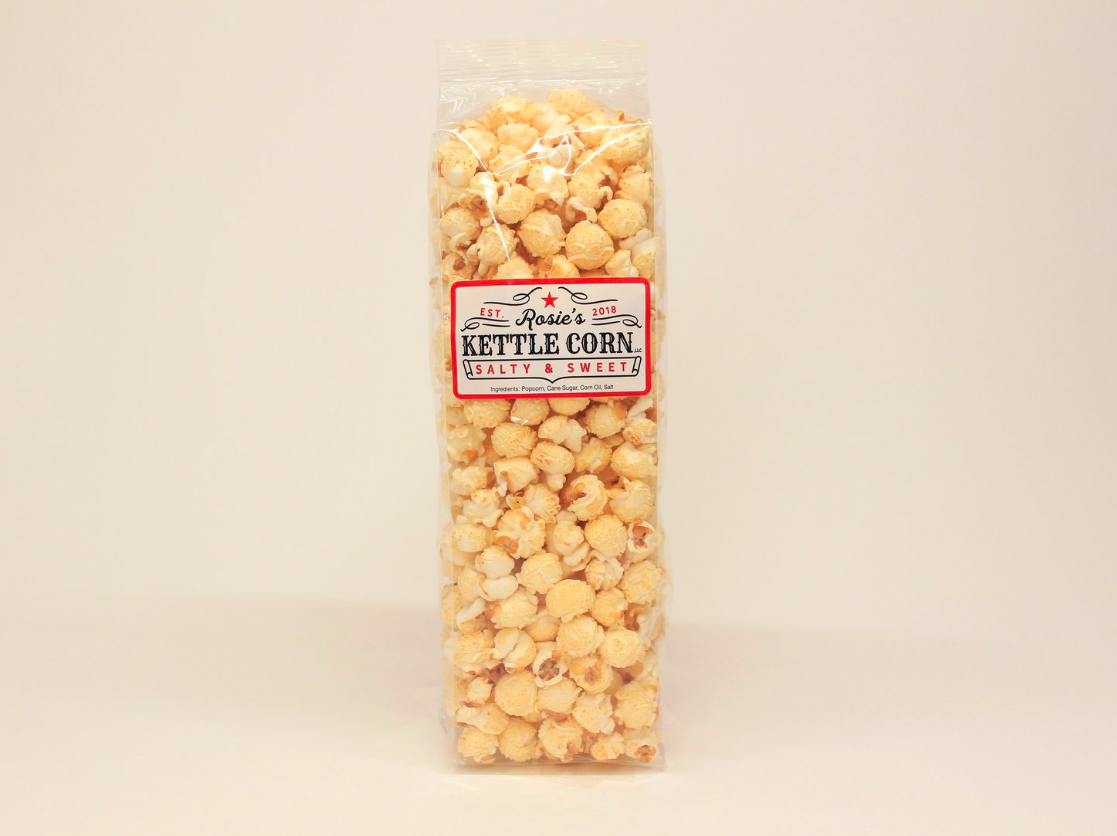
Some makers say where their ingredients come from. The Pasta Lab bag in the product photo reads "Pasta made with local grains & ingredients from the Mid-Atlantic region. Produced in Philadelphia, PA." Rosie's Kettle Corn in Coatesville, Pennsylvania, says its popcorn is sourced locally in Lancaster County. Loudounberry Farm & Garden in Virginia lists blackberries, blueberries and black raspberries on its Black Bear Jam, without saying where the fruit was grown, which is the kind of question worth asking.

See which makers list where their ingredients come from.
Shop the catalogSources
- Weber and Matthews, Food-Miles and the Relative Climate Impacts of Food Choices in the United States, Environmental Science & Technology, 2008 (PubMed abstract)
- Li et al., Global food-miles account for nearly 20% of total food-systems emissions, Nature Food, June 2022
- Pirog et al., Food, Fuel, and Freeways, Leopold Center for Sustainable Agriculture, Iowa State University, June 2001 (archived PDF)
- USDA Economic Research Service, Chart of Note on imported shares of fresh fruit and vegetables, January 2025
- Carbon Brief, Food miles have larger climate impact than thought, study suggests, June 2022
- Ritchie, Food production is responsible for one-quarter of the world's greenhouse gas emissions, Our World in Data, November 2019
- Ritchie, You want to reduce the carbon footprint of your food? Focus on what you eat, not whether your food is local, Our World in Data, January 2020
- Martinez et al., Local Food Systems: Concepts, Impacts, and Issues (ERR-97), USDA Economic Research Service, 2010
- Wikipedia, Food miles
Food miles FAQs
Frequently asked questions
How far does the average meal travel to get to your table?
No current study measures a meal. The best US estimate, from Weber and Matthews in 2008, is about 1,640 km (roughly 1,020 miles) for final delivery from producer to store, and about 6,760 km (roughly 4,200 miles) across the whole supply chain. The popular "1,500 miles" figure describes trucked produce arriving in Chicago in 1998.
What is meant by food miles?
Food miles are the distance food travels from where it is grown or made to where it is eaten. The term dates to the UK in the early 1990s, according to Wikipedia. Researchers now look at transport emissions alongside distance, since a ship, a truck and a plane differ greatly per mile.
Is eating local better for the environment?
Sometimes, and usually by less than people expect. For most foods, transport is under 10 percent of total emissions, so what you eat and how it was produced matters more. Local wins most clearly when it replaces air-freighted food. For more on the case for local sourcing, read why locally sourced products matter.
What share of food emissions comes from transport?
It depends on the study. Our World in Data puts transport at 6 percent of global food emissions, Weber and Matthews found 11 percent for US household food in 2008, and Li et al. estimated about 19 percent globally in 2022 using a wider model that critics say may overstate it.
Where are LocalCart makers based?
Most are in the Mid-Atlantic, in states such as Virginia, Maryland and Pennsylvania, and each one ships its own products. LocalCart's brand story describes the goal as helping people discover local food producers from around the country.
Local food & small-batch shopping guides
More from the LocalCart blog