Cart is empty


The short answer: about one dollar in five. Brick Meets Click's third-quarter 2026 survey release put online orders at 20.9 percent of total US grocery spending from July to September 2026, a record for the survey, with online grocery sales up 20.7 percent from a year earlier.
The US Census Bureau tells a smaller story because it files sales under the seller's type of business. In its Annual Retail Trade Survey, e-commerce made up 2.9 percent of food and beverage store sales in 2022, the latest annual year published. Groceries sold online by supercenters and online retailers land in other rows.
So the honest answer to "how much grocery shopping is online" depends on who is counting. Below, each number carries its source, period and definition.
Online grocery sales & grocery ecommerce growth
A survey & the Census measure different things
Most online grocery shopping statistics come from one of two places. Federal data from the Census Bureau counts sales reported by employer businesses. Industry trackers survey shoppers about what they bought. Our earlier post on small-batch goods from makers nationwide touched on online grocery shopping statistics in passing. This one goes to the sources.
1
Online share
20.9% of US grocery spending went online in 3Q 2026, Brick Meets Click survey
2
Growth
Online grocery sales up 20.7% from 3Q 2025, the same survey
3
Reach
Almost 62% of US households shopped for groceries online each month in 3Q 2026
4
Store-based view
$10.3 billion in e-commerce at food and beverage stores, 2Q 2026, Census
20.9%
of total US grocery spending went online in 3Q 2026, a record for the survey
+20.7%
online grocery sales vs 3Q 2025, the eighth straight quarter above 20%
$12.7B
US online grocery sales in December 2025, a monthly record, up 32% from a year earlier
$10.3B
e-commerce sales at US food and beverage stores in 2Q 2026, not seasonally adjusted
What the Census counts
Official, but filed by store type
The Census Bureau's Quarterly Retail E-Commerce Sales report for the second quarter of 2026, first released August 18, 2026, put total US retail e-commerce at $340.2 billion, 17.1 percent of all retail sales after seasonal adjustment. E-commerce grew 12.2 percent from a year earlier while total retail grew 6.7 percent. The bureau counts a sale as e-commerce when the order is placed or the price is negotiated online, whether or not payment happens online.
Grocery shows up in a supplemental table that splits e-commerce by type of store. Food and beverage stores reported $10.34 billion of e-commerce in 2Q 2026, up from $9.56 billion in 2Q 2025, a gain of about 8.1 percent by our math. That row covers supermarkets, specialty food stores and beer, wine and liquor stores. A grocery order placed with a warehouse club or an online-only retailer is filed under that seller's own category.
2019$8.5B
2020$23.1B
2021$26.2B
2022$27.2B
Source: US Census Bureau, Annual Retail Trade Survey, 2022 benchmarked release (the latest annual data), NAICS 445, employer firms. E-commerce was 1.1% of these stores' sales in 2019 and 2.9% in 2022.
The annual numbers show the 2020 jump plainly. Food and beverage store e-commerce nearly tripled from 2019 to 2020 and kept climbing more slowly after that. The same survey's merchandise-line tables add the other half of the picture: electronic shopping and mail-order houses sold $36.6 billion of food, beer and wine online in 2022, up from $16.6 billion in 2019. That online retailer figure is larger than the store figure.
What the shopper survey counts
Monthly, household level, with a sample
Brick Meets Click has run its Grocery Shopper Survey every month since March 2020. It asks US adults who shop for their household's groceries what they bought online and how, then weights the answers. The December 2025 wave drew 1,488 responses. It is the most frequently updated source for online grocery statistics, and it is still a survey, so read each month as an estimate.
Aug 2025$11.2B
Sep 2025$12.5B
Oct 2025$11.6B
Dec 2025$12.7B
Sources: Brick Meets Click monthly releases for August, September, October and December 2025 (November not shown). Survey estimates, not reported store sales.
Growth swings from month to month. September 2025 came in up 31 percent from a year earlier, while October 2025 rose 10.5 percent. The longer view matters too. For all of 2023, the survey put online grocery sales at $95.8 billion, down 1.2 percent from 2022. Every 2025 month shown in the chart above grew by double digits from a year earlier.
| Measure | Source | What it counts | Latest figure |
|---|---|---|---|
| Online share of grocery spending | Brick Meets Click survey | Household grocery spending online vs total | 20.9%, 3Q 2026 |
| All retail e-commerce | Census quarterly report | Online orders at employer retailers | 17.1% of retail, 2Q 2026 |
| Food and beverage store e-commerce | Census supplemental table | Online orders at grocery and other food stores | $10.3B, 2Q 2026 |
| Same, as share of store sales | Census annual survey | E-commerce over total sales, NAICS 445 | 2.9%, 2022 |
| Food, beer and wine sold by online retailers | Census annual survey | Merchandise line at nonstore sellers | $36.6B, 2022 |
Reading a headline numberWhen an article says some share of groceries is bought online, check three things: the period (a month, a quarter or a year), the base (all grocery spending, or one store type's sales) and whether it comes from a survey or from reported sales. The 20.9 percent and 2.9 percent figures above differ on all three.
What shoppers choosing local online grocery delivery want
Delivery drives growth while pickup stalls
The same survey breaks online grocery sales into three ways of getting the order: delivery (by a retailer or a service such as Instacart or Shipt), grocery pickup at the store and ship-to-home by a parcel carrier such as FedEx, UPS or USPS. In 3Q 2026, delivery grew more than 30 percent and accounted for about three-quarters of all online grocery growth. Pickup grew in the mid-single digits. Ship-to-home grew slightly slower than the 20.7 percent total.
Pickup46%
Delivery37%
Ship-to-home17%
Source: Brick Meets Click, 2023 annual eGrocery results (released January 2024). Shares rounded in the source.
That 2023 split has since turned over. In August 2025, delivery made up 45 percent of online grocery sales after a 30 percent jump from a year earlier, ship-to-home rose 19 percent, and pickup sales fell 4 percent and lost more than 6 points of share. The 3Q 2026 release says delivery gained another 5 points of share over the past year.
About 14%
rise in order frequency among monthly online grocery shoppers, 3Q 2026 vs a year earlier
17%
of monthly online grocery shoppers used all three methods in 3Q 2026: delivery, pickup and ship-to-home
+14%
rise in average ship-to-home order value in December 2025, which the survey tied to Amazon same-day fresh delivery
Put together, the online grocery growth story is about habit. Households order more often, many mix methods in the same month, and in-store grocery sales slipped from a year earlier in 3Q 2026 according to the same release. The Census retail ecommerce data points the same way at a broader level, with ecommerce sales across all retail growing almost twice as fast as total retail in 2Q 2026.
Reach keeps widening as well. The 3Q 2026 release counted nearly 64 percent of US households as monthly active online grocery shoppers in September 2026, a record for the survey, and almost 62 percent across the quarter as a whole. Some 81 percent of households have bought groceries online at least once.
Where small makers fit
Ship-to-home, pantry goods only
Grocery ecommerce at the scale of these numbers is built around supermarket baskets, fresh produce and fast delivery windows. Small food makers sell into a narrower slice, closer to the ship-to-home channel: shelf-stable goods packed and mailed by the business that made them.
LocalCart works that way. Each maker ships its own products, so a cart with items from two makers shows two shipping charges at checkout, with rates calculated for your address. LocalCart does not run a local delivery service, its terms do not guarantee same-day shipping, and nothing on the site offers refrigerated shipping. The store sells pantry goods, sauces, preserves, snacks and drink kits, and no fresh produce, meat, dairy or bread. Checkout takes Stripe or PayPal, works without an account and lists the United States and the US Virgin Islands as ship-to countries.
Before you order pantry goods from small makers online0 of 5 done
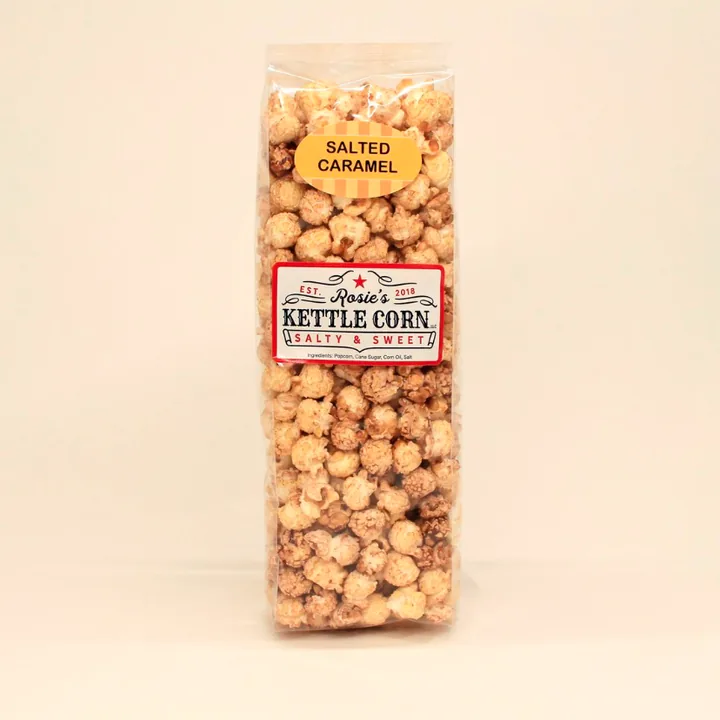
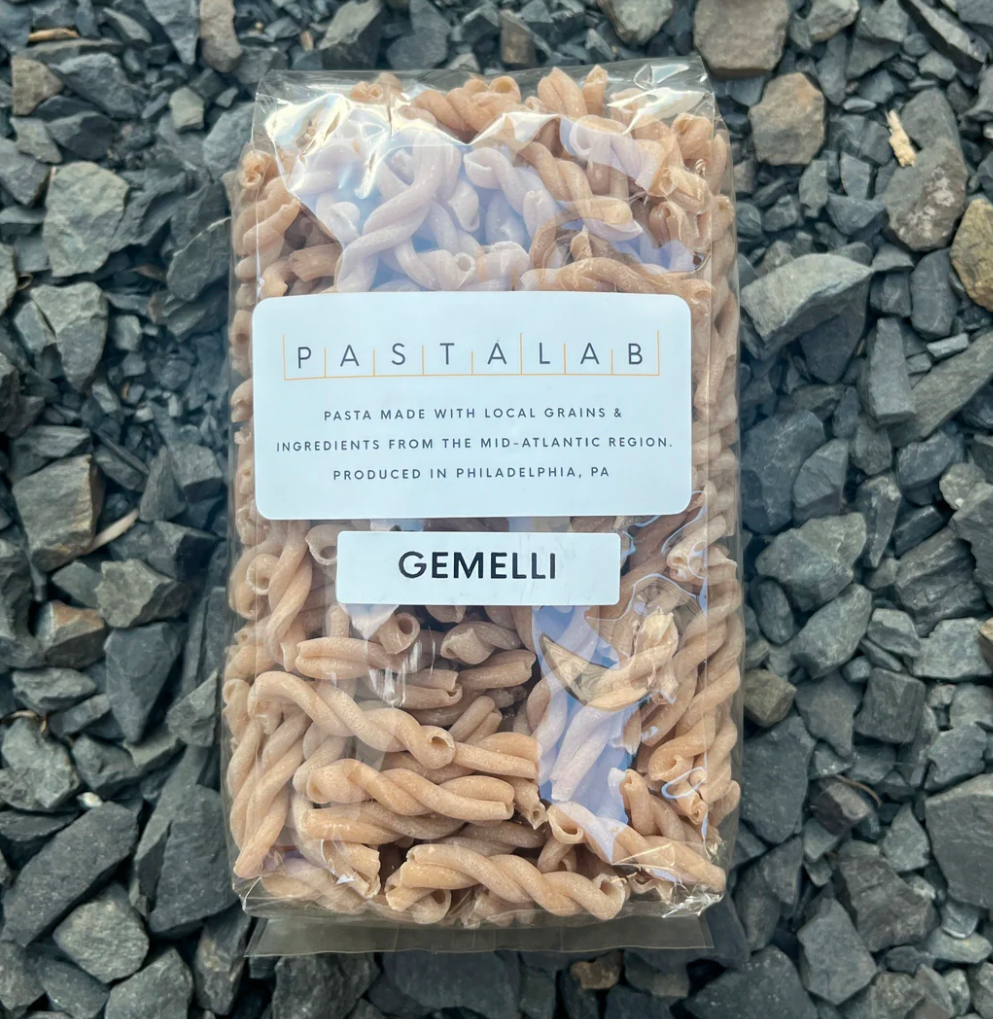
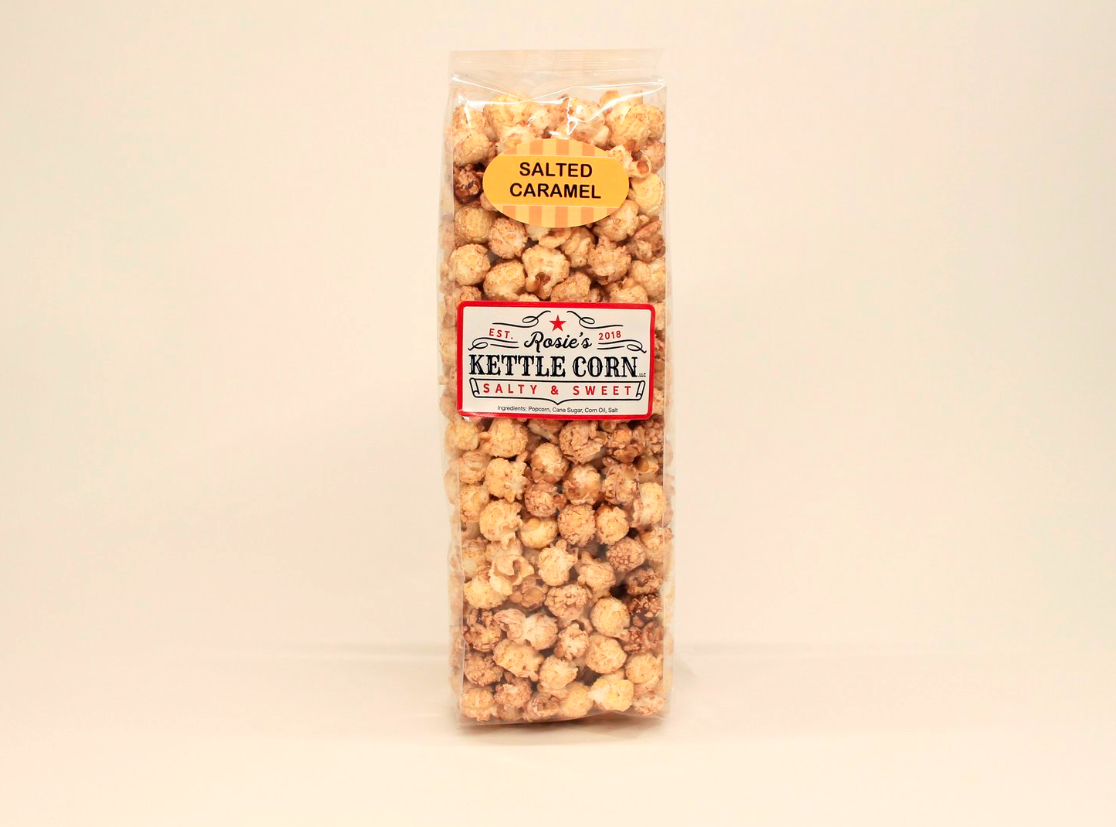
Three examples from different makers. Pasta Lab's box holds four 12 oz bags of dried pasta that need no refrigeration and are best used within 6 months. Rosie's Kettle Corn in Coatesville, Pennsylvania, lists its ingredients as popcorn, corn oil, sugar and salt. Vesta Kitchen in Pottstown, Pennsylvania, makes Sunday Kind of Love, a tomato sauce in a 16 fl oz jar.

Browse shelf-stable pantry goods shipped by the makers who made them.
Shop the catalogSources
- Brick Meets Click, U.S. eGrocery Sales for 3Q26 Climb 21% Versus Last Year, October 2026
- US Census Bureau, Annual Retail Trade Survey, 2022 benchmarked annual report tables (total, e-commerce and merchandise-line sales)
- Brick Meets Click, U.S. eGrocery Sales Surge 32% YoY to a Record $12.7 Billion in December 2025, January 2026
- US Census Bureau, Quarterly Retail E-Commerce Sales, 2nd Quarter 2026, August 2026
- US Census Bureau, Quarterly E-Commerce Supplemental Tables, 2nd Quarter 2026 (XLSX)
- Brick Meets Click, September 2025 U.S. eGrocery Sales Surge to New High (September 2025 data)
- Brick Meets Click, U.S. eGrocery Total $11.6 Billion in October 2025 (October 2025 data)
- Brick Meets Click, 2023 U.S. eGrocery Sales Total $95.8 Billion, January 2024
- Brick Meets Click, August 2025 U.S. eGrocery Sales Hit a Record High of $11.2 Billion (August 2025 data)
Online grocery statistics FAQs
Frequently asked questions
What percent of grocery shopping is done online?
About 20.9 percent of US grocery spending went online in the third quarter of 2026, according to the Brick Meets Click shopper survey. Census store data gives a lower figure, 2.9 percent of food and beverage store sales in 2022, because it leaves out groceries sold online by supercenters and online retailers. Both are right for what they measure.
Is online food shopping still growing?
Yes. Brick Meets Click reported online grocery sales up 20.7 percent in 3Q 2026 from a year earlier. The Census supplemental table shows e-commerce at food and beverage stores up about 8 percent in 2Q 2026 from 2Q 2025. Online food shopping did dip once, in 2023, when the survey recorded a 1.2 percent decline.
Which grocery delivery statistics can I trust most?
For official totals, use the Census Bureau, which surveys employer businesses and publishes its methods. For the online share of household grocery spending and the split between delivery, pickup and ship-to-home, the Brick Meets Click survey is updated monthly, with roughly 1,500 responses a month. Check the date and definition on any grocery delivery statistics before you repeat them.
Can I get local online grocery delivery through LocalCart?
Not in the same-day sense. LocalCart makers ship their own shelf-stable products to your address, and checkout shows each maker's shipping charge. There is no local delivery service, so local online grocery delivery for fresh food still means a grocer or delivery app. Read more about LocalCart, or browse the LocalCart catalog to see what ships.
What does the Census count as e-commerce?
Per the quarterly report, it is a sale where the buyer places the order, or the price and terms are negotiated, over the internet, a mobile device, email or a similar online system. Payment may or may not happen online. Since the April 2025 benchmark, the quarterly estimates cover employer businesses only.
Local food & small-batch shopping guides
More from the LocalCart blog