Cart is empty


The short answer: when researchers trace where a store's revenue goes, independent businesses spend far more of it close to home. The American Independent Business Alliance averages the retail studies done by the firm Civic Economics at 52.9 percent of each purchase recirculated locally at independents, against 13.6 percent at chain stores.
Grocery is a harder case, because those recirculation studies cover retailers and restaurants in general, not grocers. What exists is a 2026 trade association report on independent grocers, a 2012 co-op study and USDA spending data that shows where the food dollar lands.
Below, each figure carries its year, place and definition, plus a note when a number is old, small or sponsored by an interested party.
Local multiplier effect data
Independents return more, city after city
Most shop local statistics trace back to one method. Researchers ask local independents for their books (payroll, local suppliers, owner profit spent in town, donations), then build a comparable profile for national chains from public filings. The gap they measure is called the local premium. A short overview of how this plays out on a single main street sits in our post on shop local statistics and neighborhood character.
1
Retail premium
52.9% vs 13.6% recirculated locally, independents vs chains, Civic Economics average
2
Restaurant premium
60.7% vs 30.4% in Dane County, Wisconsin, 2022
3
Grocery footprint
$557.5 billion in output from independent grocers, NGA report, 2024 data
4
Spending base
$1.10 trillion spent on food at home in the US in 2025, USDA
52.9%
of each purchase at local independent retailers recirculated locally, vs 13.6% at chains (average of Civic Economics retail studies)
$45 vs $14
local spending generated per $100 at independents vs a big-box chain in Midcoast Maine
47.4%
of revenue returned locally by independent retailers in Dane County, Wisconsin
60.7%
of revenue returned locally by independent restaurants there, vs 30.4% for national chains
$68 vs $43
local economic activity per $100 at 10 independents vs 10 chains in Andersonville, Chicago
Nearly $140M
new regional activity, plus 1,600 jobs, modeled from a 10% shift to local firms in Kent County, Michigan
Independent restaurants, Dane County60.7%
Independent retailers, Civic Economics average52.9%
Independent retailers, Dane County47.4%
Chain restaurants, Dane County30.4%
Chain retailers, Civic Economics average13.6%
Sources: AMIBA summary of Civic Economics retail studies (undated average), Dane County Indie Impact study by Civic Economics (2022). Studies use surveys of volunteer businesses, so treat each figure as an estimate.
Restaurants post the biggest numbers because so much of their revenue goes to local payroll. AMIBA's own 2021 explainer makes that point and warns that most retailers create a more modest multiplier unless they buy an unusually high share of their stock locally. That matters for groceries, where most of what sits on the shelf is made elsewhere.
Two cautions apply. First, the participating independents volunteer, and local business alliances usually commission the work, so the samples are small and not random. Second, the figure is the share of revenue a business spends locally on owner profits, wages, goods and services, and charity. It does not mean that money stays in town forever.
Buy local statistics also age badly. The Andersonville figure from 2004 still circulates on flyers, though it describes 10 businesses in one Chicago neighborhood more than 20 years ago. The Dane County study from 2022 is one of the newest in the series, and its chain retail figure (13.6 percent) matches the AMIBA average.
What local independent grocery stores return
Grocery data measures size, rarely recirculation
Grocery is where consumer spending is largest and most routine. USDA's Economic Research Service puts food-at-home spending at $1.10 trillion in 2025, out of $2.51 trillion in total US food spending, and says consumers spent 4.8 percent of disposable income on food at home that year.
Where does that money go first? In the ERS Food Expenditure Series, grocery stores took 56.2 percent of 2025 food-at-home spending and warehouse clubs plus supercenters took 26.4 percent. Direct sales by farmers, manufacturers and wholesalers were 1.2 percent, about $13.4 billion.
Grocery stores56.2%
Warehouse clubs and supercenters26.4%
Other stores and foodservice11.1%
Other food stores3.5%
Direct selling by farmers, makers, wholesalers1.2%
Convenience stores1.2%
Source: USDA ERS Food Expenditure Series, nominal food-at-home sales with taxes and tips, 2025 (shares computed by LocalCart from the published dollar figures). Home production and donations, 0.3%, not shown.
The 2026 independent grocer report
Big totals, measured for the whole country
The newest grocery-specific numbers come from a May 2026 report for the National Grocers Association, written by Arizona State University economists Timothy Richards and Peter Rupert and sponsored by C&S Wholesale Grocers and UNFI. Using 2024 store-level sales data, it credits independent grocers with $353.5 billion in direct sales, 38.4 percent of a $920 billion food retail sector, and $557.5 billion in total economic output.
$557.5B
total annual economic output tied to independent grocers, about 2% of US GDP
1.48M
jobs supported, including 1.14 million people employed directly by independent grocers
Read the fine print before quoting it. Its 1.58 multiplier (each $1 of sales tied to $1.58 of activity) is a national input-output estimate, so it does not say how much stays in your county. "Independent" means NGA members or potential members, matched against NielsenIQ store data. Beyond direct sales, the full report credits $97.7 billion of output to the supply chain and $106.3 billion to spending by workers.
NGA's previous study, released in 2021 put independents at 33 percent of grocery sales in 2020, up from 25 percent a decade earlier. The two reports used different firms and methods, which makes the jump to 38.4 percent a loose comparison at best.
The co-op comparison
Closer to a local premium for groceries
The nearest thing to a grocery multiplier study is Healthy Foods Healthy Communities, a 2012 study commissioned by National Co+op Grocers and run by the ICA Group. It found $0.38 of each dollar spent at a food co-op reinvested locally, against $0.24 at conventional grocers, and $1,604 of local activity per $1,000 spent, $239 more than at a conventional store. Co-ops worked with an average of 157 local farmers and food producers, conventional grocers with 65, and local products made up 20 percent of co-op sales against 6 percent. The sponsor has an interest in the result, and the data is now 14 years old.
| Study | Year, place | What it counts | Watch for |
|---|---|---|---|
| Civic Economics retail average | Multiple cities, undated average | Share of revenue spent locally, independents vs chains | Volunteer samples, local sponsors |
| Dane County Indie Impact | 2022, Wisconsin | Local recirculation by sector | Chain retail figures from four national chains |
| NGA Economic Impact Analysis | 2024 data, US | National output, jobs, taxes | Trade group report, national multiplier, not local |
| Healthy Foods Healthy Communities | 2012, US co-ops | Local reinvestment, co-op vs conventional | Sponsored by co-op group, old data |
| SBA Office of Advocacy FAQ | 2026 edition, US | Firms under 500 employees | Size only, not where the owner lives |
Small business statistics get mixed into this debate too, and they measure something else. The SBA Office of Advocacy's 2026 FAQ counts 36.2 million small businesses, 99.9 percent of all firms, employing 62.3 million people, or 45.9 percent of private sector workers. Its definition is an independent business with fewer than 500 employees, which says nothing about whether the owner lives nearby. For the local economy, ownership and sourcing matter more than headcount.
For a sense of scale on the other side of the counter, ERS figures that 13.8 cents of a typical 2024 food dollar spent on domestically produced food went to retail trade. Independent stores and chains share that slice, and the local multiplier effect comes from how each one spends it: on local staff, local accountants and local suppliers, or on headquarters elsewhere. The local multiplier studies AMIBA collects describe exactly that split.
How to shop local with the numbers in mind
Ownership, sourcing, then distance
The studies point to a few habits that move more money than a slogan does. The biggest lever is where the business spends its revenue, which you can often ask about directly.
Questions to ask a store or maker0 of 5 done
Local independent grocery stores pass these questions more often than chains do, but not always. A franchise grocer can be locally owned yet buy everything through a national wholesaler. A small family market can stock regional brands, carry a local bank account and still pay rent to an out-of-state landlord. Each answer moves its local business impact up or down a little.
Scale matters more than purity. The 2008 Grand Rapids study modeled a 10 percent shift of spending from chains to local firms in Kent County and found nearly $140 million in new regional activity and 1,600 jobs. That is about one shopping trip in ten, not a whole new way of shopping.
One honest limitOrdering from a maker in another state does little for your own town's multiplier, a point AMIBA makes about buying remotely on the web. It does send the money to an independent business in the maker's town, which is where that maker's payroll and suppliers sit.
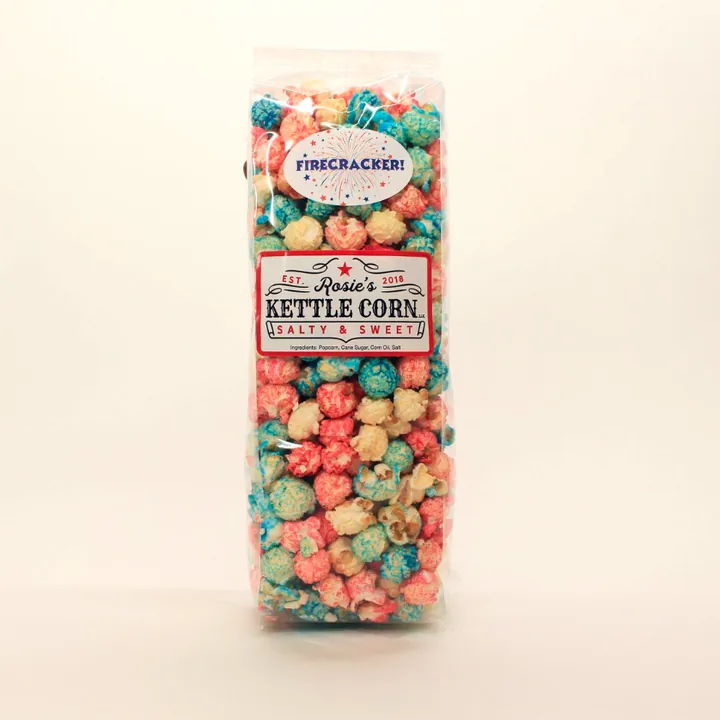
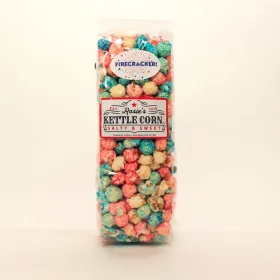
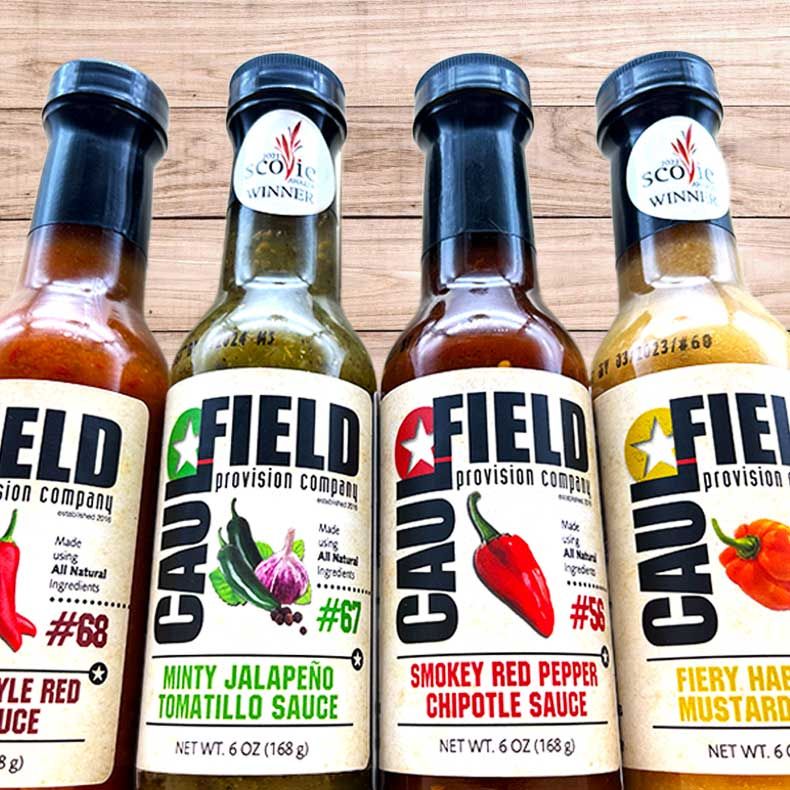
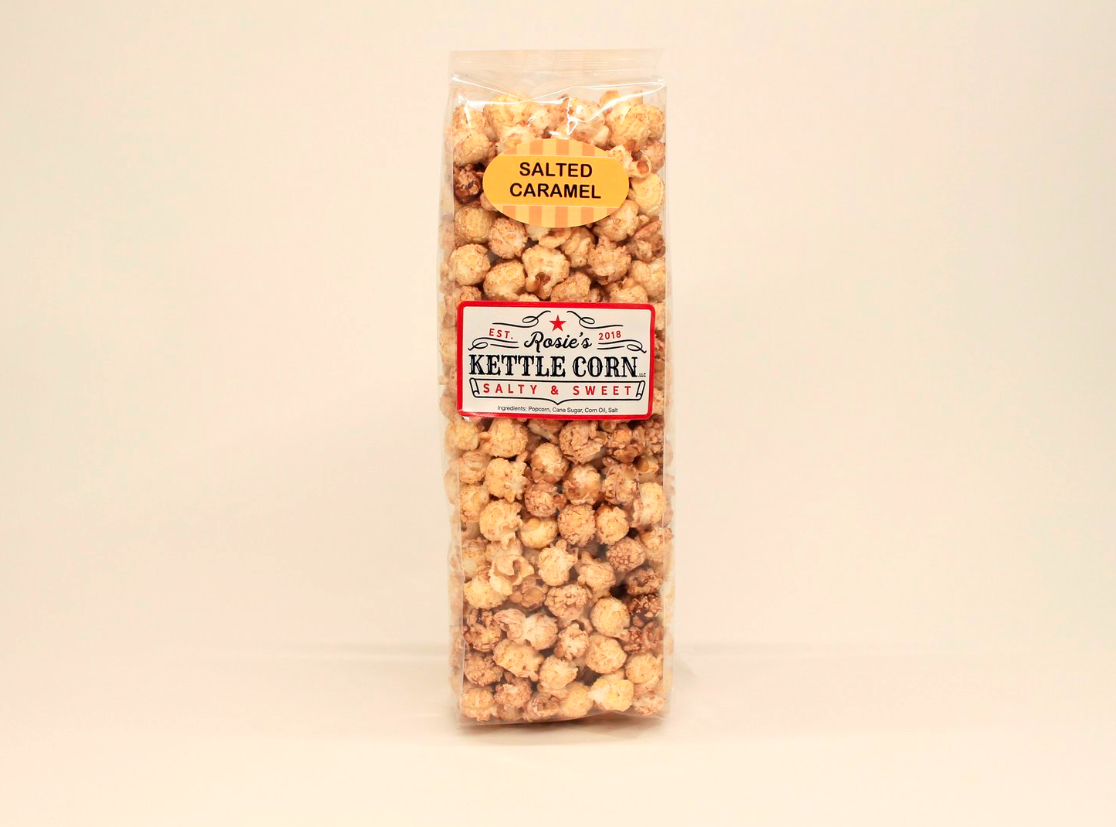
That is the gap LocalCart sits in. Each independent business on it ships its own products, so the order comes straight from the maker. Caulfield Provision Company in Potomac, Maryland, is a woman owned, family operated sauce business. Rosie's Kettle Corn in Coatesville, Pennsylvania, uses popcorn sourced in Lancaster County. McCutcheon's in Frederick, Maryland, says it has more than 30 full-time employees, 16 of them family members from the 4th and 5th generations. There is more on the reasons people choose this route in our post on how shopping local strengthens communities.

Browse sauces, preserves and pantry goods from independent makers.
Shop the catalogSources
- American Independent Business Alliance, The Local Multiplier Effect (average of Civic Economics retail studies)
- Institute for Local Self-Reliance, The Economic Impact of Locally Owned Businesses vs. Chains: A Case Study in Midcoast Maine (PDF), 2003
- Dane Buy Local, Independent Businesses Recirculate More Revenue in Dane County (Civic Economics Indie Impact study), 2022 to 2023
- Institute for Local Self-Reliance, Independent Businesses Produce Bigger Economic Benefits, Study Concludes (Andersonville), 2004
- Institute for Local Self-Reliance, Modest Changes in Shopping Habits Would Produce Big Economic Benefits (Grand Rapids Local Works), 2008
- American Independent Business Alliance, The Local Multiplier Effect explainer (PDF), 2021
- USDA Economic Research Service, Ag and Food Statistics: Food Prices and Spending, 2026
- USDA Economic Research Service, Food Expenditure Series, updated 2026
- National Grocers Association, New NGA Economic Impact Report (Arizona State University), May 2026
- Richards and Rupert, National Grocers Association Economic Impact Analysis: Report (PDF), 2026
- National Grocers Association, New Study Highlights Independent Community Grocers' Pivotal Role, June 2021
- National Co+op Grocers, Healthy Foods Healthy Communities (ICA Group study), 2012
- SBA Office of Advocacy, Frequently Asked Questions About Small Business, February 2026
- American Independent Business Alliance, Local Multiplier Effect project page
- USDA Economic Research Service, Local Food Systems: Concepts, Impacts, and Issues (ERR-97), 2010
Shop local statistics FAQs
Frequently asked questions
What percentage of money spent locally stays in the community?
In the retail studies averaged by AMIBA, independents recirculate about 52.9 percent of each purchase locally and chains about 13.6 percent. Restaurants run higher. In Dane County, Wisconsin, in 2022, independent restaurants returned 60.7 percent of revenue locally. These are survey-based estimates for specific places, so no single national figure exists.
Is the $68 out of $100 shop local statistic accurate?
It comes from a 2004 Civic Economics study of 10 independents and 10 chains in Andersonville, Chicago, which found $68 of local activity per $100 at independents and $43 at chains. You may also see $73, from early press coverage, but the published study says $68. It is a real finding for one neighborhood, more than 20 years old, so newer studies are a better guide.
What are the statistics for small businesses in the United States?
The SBA Office of Advocacy counted 36,207,130 small businesses in its February 2026 FAQ, 99.9 percent of all firms. They employ 62.3 million people, 45.9 percent of private sector workers. "Small" means fewer than 500 employees, so the count describes size, not where the owner lives.
What does it mean to buy locally?
There is no single legal definition. USDA researchers note that the 2008 Farm Act treats a product as locally or regionally produced if it travels less than 400 miles or stays within its state, but stores, shoppers and programs all draw the line differently. Most shop local campaigns focus on ownership: a locally owned independent business rather than a chain.
Does buying from LocalCart count as shopping local?
It counts as buying from independent makers, most of them in Mid-Atlantic states such as Virginia, Maryland and Pennsylvania. Whether they are local to you depends on where you live. LocalCart's brand story describes the goal as helping people discover local food producers from around the country, and each maker ships its own orders.
Local food & small-batch shopping guides
More from the LocalCart blog